Manage and monitor the system
Introduction
This tutorial briefly explains the functionalities of Qflow Admin, this tool can be used to manage and monitor varios aspects of the system such as services and sites, extended properties, licenses, notification services, workspaces and system parameters.
Each option corresponds to a functionality of the tool. We will exemplify how some of them are used.
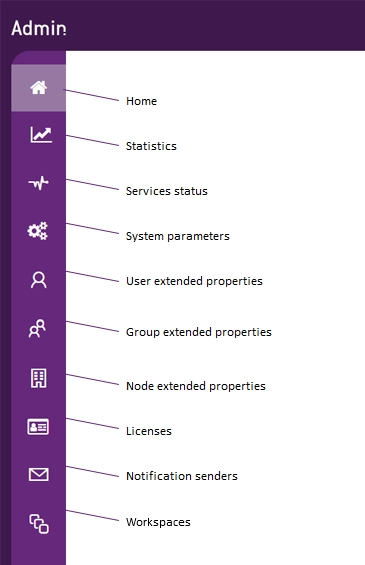
Fig. 258 Side menu
System parameters
System parameters are predefined parameters that control various aspects of the product’s operation. They can be numeric, true / false (Boolean), text or image type.
Some clarifications about the list:
If the parameter information’s row is grayed out, it means that the parameter is read-only and cannot be edited.
Clicking on the information icon “i” will display a description of the parameter’s purpose. Click anywhere on the list to close it.
To edit any parameter that allows it, click on it and then on the edit button. A panel will open to edit its value.
For example, you can change Qflow Task’s theme.
Fig. 259 Qflow Task’s theme change
Then, Qflow Task will be customized with the black color:
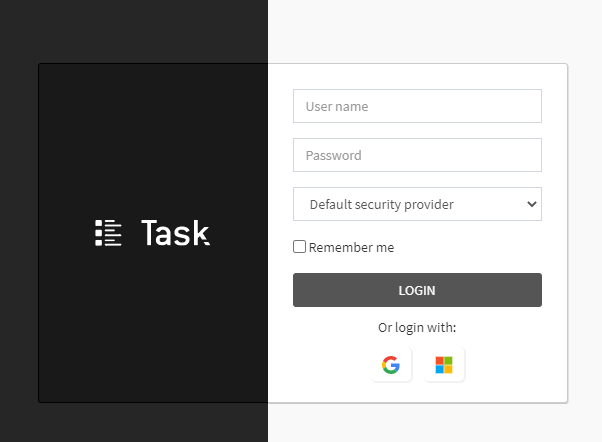
Fig. 260 Black theme
Another parameter that can be edited is the required protection comment for Qflow Design. To edit packages or flow templates, they must be checked out and then checked in again to save any changes.
Each time this action is performed, by default, Qflow asks for a comment to be entered. However, the mandatory required comment can be disabled within the system parameters.
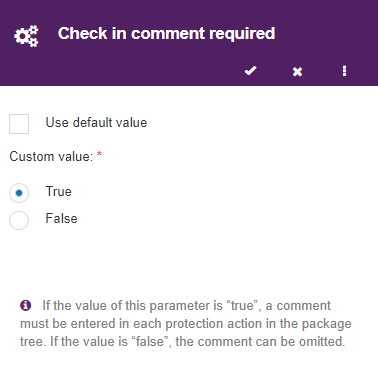
Fig. 261 Add comment
Statistics
Within the “Statistics” section, the site displays the usage of Qflow There are two tabs within the section, one showing “Q-points usage” and the other showing “Usage history”.
If we are working from the default workspace, we will see a dropdown list in the top right corner of the section. This will allow us to select from all existing workspaces and view statistics for each one of them. For workspaces other than the default one, only their own consumption statistics will be shown.
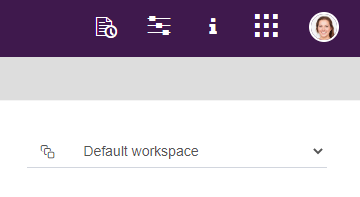
Fig. 262 Workspace selection
Q-points usage
This report contains two charts, both related to the consumption of Q-pointsin the current month. The first chart displays Q-points usage throughout the current month. On the other hand, the second chart indicates the same as the previous one but it also groups Q-points by process template.
The various charts show data grouped in different ways. You can view you can view the data by the current day or by month.
The chart of the total usage of Q-points will appear as follows:
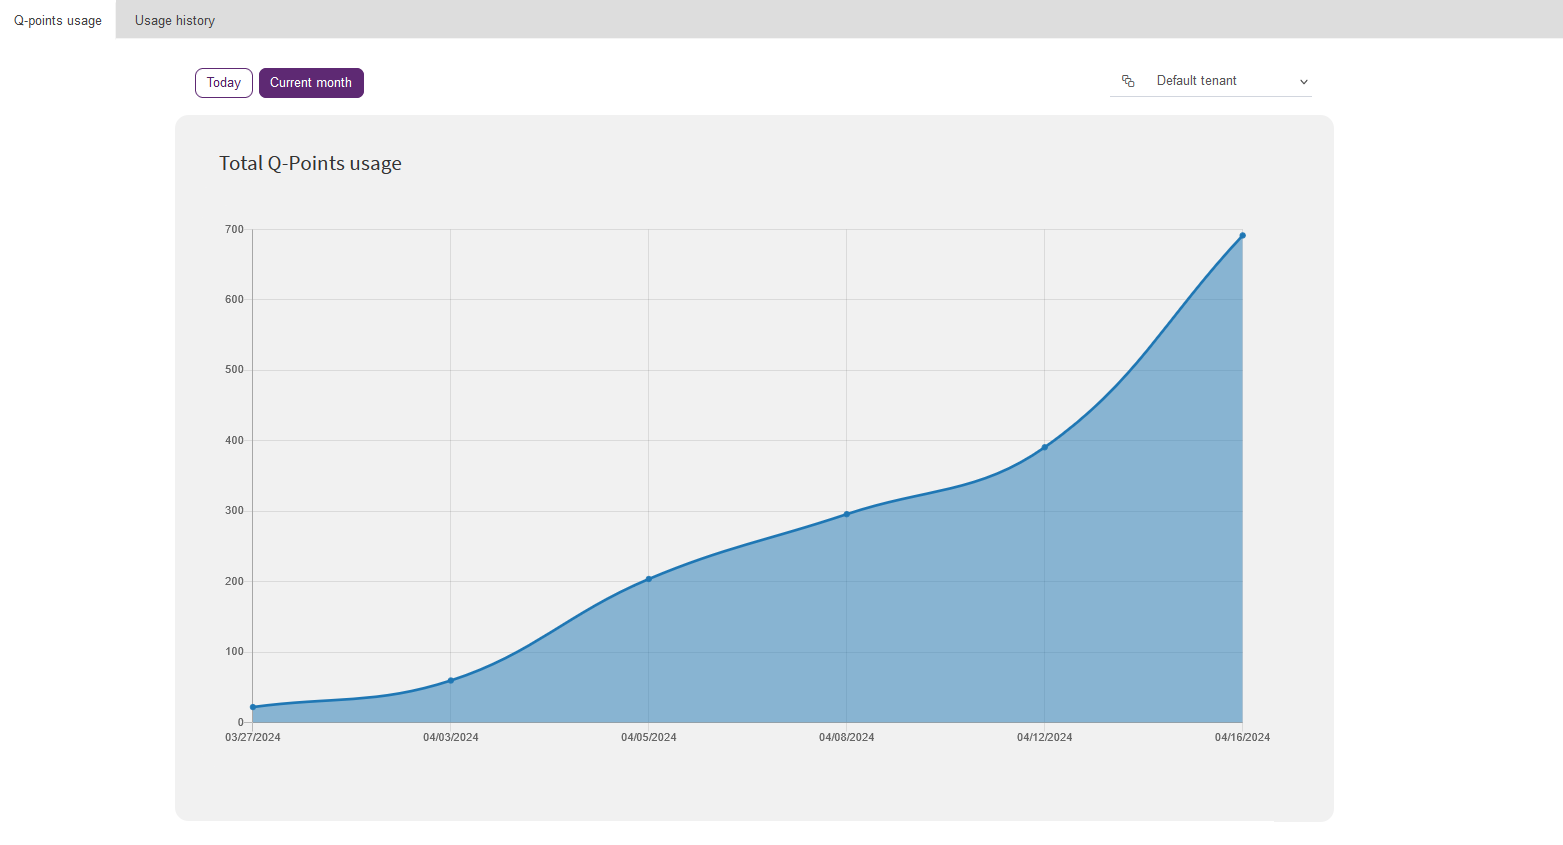
Fig. 263 Total Q-points usage
The template chart of Q-points usage will appear as follows:
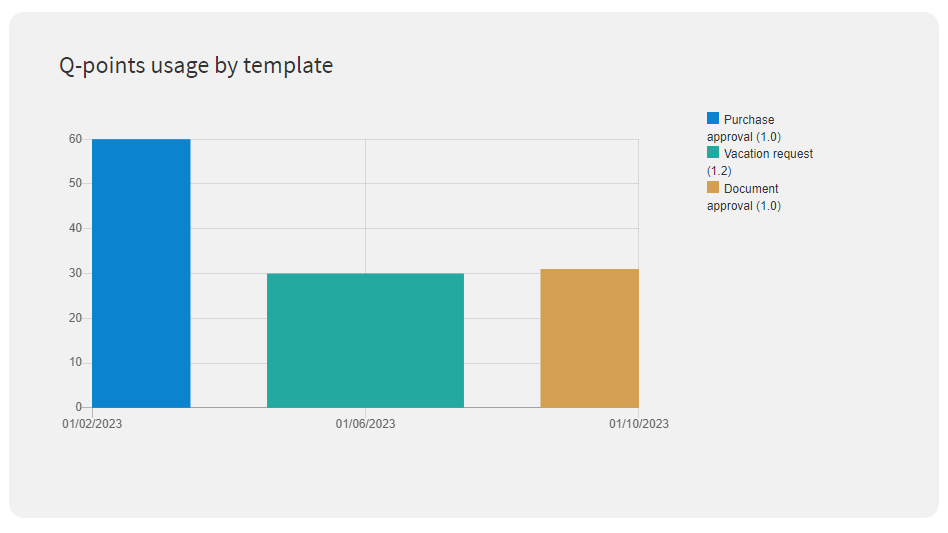
Fig. 264 Q-points usage by template
In the OnPremise version of the product, this report is not available by default (it is in the Cloud version). If you want to enable this feature, please refer to the Qflow Admin manual.
Finally, if you want more information about the rest of the site’s options that were not detailed in the tutorial, you can refer to the Qflow Admin manual.