Administrate and monitor the system
Introduction
This tutorial briefly explains the features of Qflow Admin, the tool that is used to manage and monitor different aspects of the system such as services and sites, extended properties, licenses, notification services, workspaces and system parameters.
In this tutorial the features for both of Qflow’s versions, Cloud and OnPremise will be described. These versions have differences between them. Icons will be used to mark the differences between them, which represent the version in which each feature is available:
Feature available in Qflow Cloud
Feature available in Qflow OnPremise
Each of the options corresponds to a tool feature. How some of them are used will be demonstrated next.
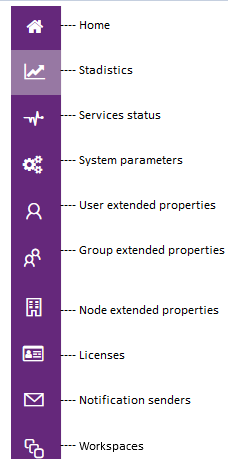
System parameters
System parameters are predefined parameters that control various aspects of the product’s operation. Their type can be numeric, true / false (Boolean), text or image.
Some clarifications about the list:
If the row with the parameter information is grayed out, it means that the parameter is read-only and cannot be edited.
By clicking on the information icon “i”, a description of the parameter’s objective will be displayed. Click on any part of the list to close it.
To edit any parameter that allows it, click on it and then on the edit button. A panel will open to edit its value.
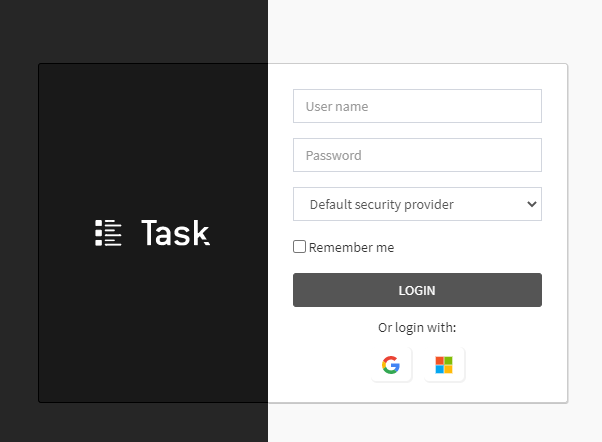
For example, you can change the theme of Qflow Task.
Then, Qflow Task will be personalized with the color black:
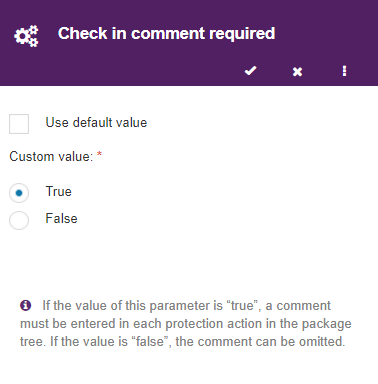
Another parameter that can be edited is the required protection comment in Qflow Design. To edit packages or flow templates they have to be checked out and then checked in to save them.
Every time this action is carried out, by default, Qflow asks for a comment to be entered. However, the required comment can be disabled within the system parameters.
Statistics
On the “Statistics” section the site shows the use of Qflow. There are two tabs within the section, one shows the “Q-points usage” and the other the “Usage history”.
If you are working from the default workspace, you will see a dropdonw list on the upper right corner of this section, which allows you to select between all existing workspaces and to see their statistics for each one of them. For workspaces other than the default, only their own consuption statistics will be shown.
Q-points usage
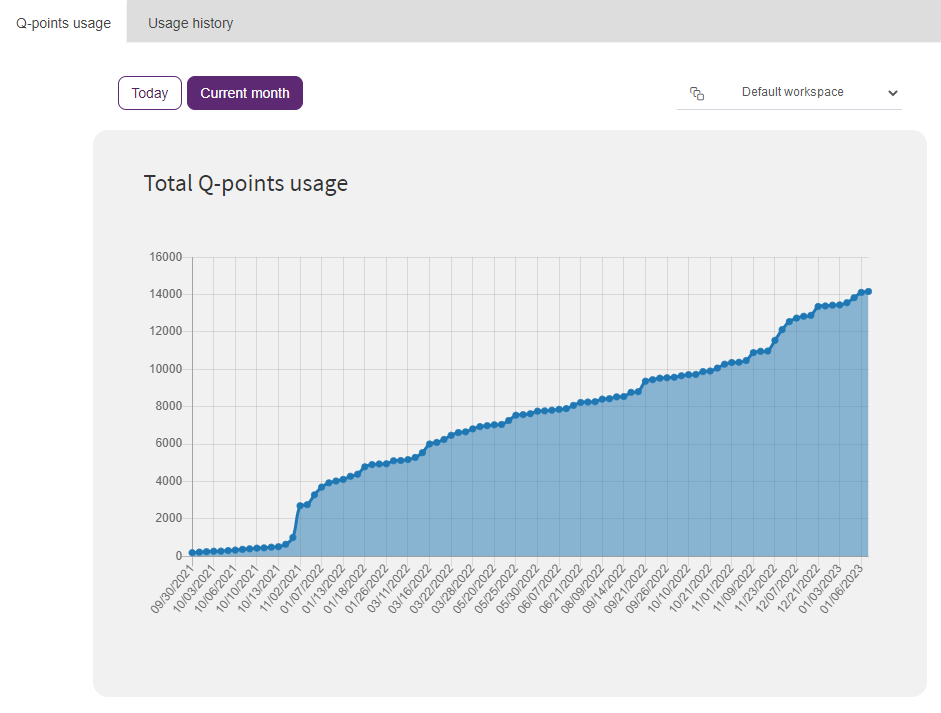
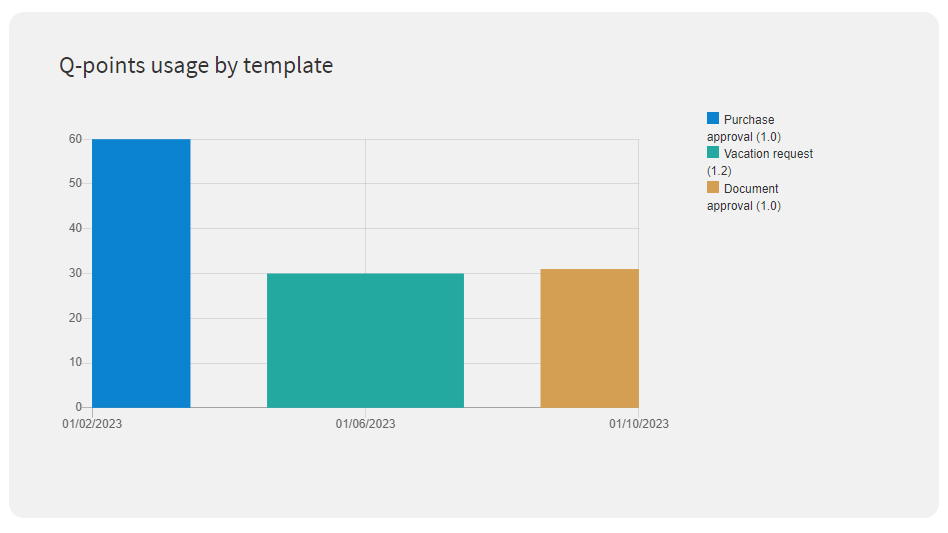
In this report there are two graphs, both related to the usage of Q-points in the current month. The first graph shows the usage of Q-points throughout the current month. On the other hand, the second graph indicates the same as the previous one but grouping the Q-points by template.
In the different graphs you can see the data grouped in different ways, you can see it by current day or by month.
The graph of the total Q-points usage will look like this:
The graph of Q-points usage by template will will look like this:
In the OnPremise version of the product this report is not available by default (it is in the Cloud version). If you want to enable this function, see the Qflow Admin manual.
Usage history
This section is only available for the Cloud version, in the OnPremise version a history is not generated.
Within it, five graphs will be displayed. The first two indicate the number of completed tasks and started flows within a time period. The remaining graphs show the history of Q-points usage, enabled users and storage use in the last year grouped by month.
In this tutorial you will be able to see within the usage history the started flows and the tasks answered in the months of September and October.
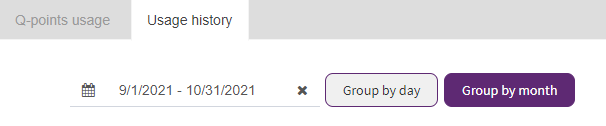
The graphs can be generated with filters, there is the option to group by month or by day (by default they are grouped by day), and a custom period can also be established (by default the current month). The filter that was applied is to group the date by month, from September 1st to October 31st, 2021.
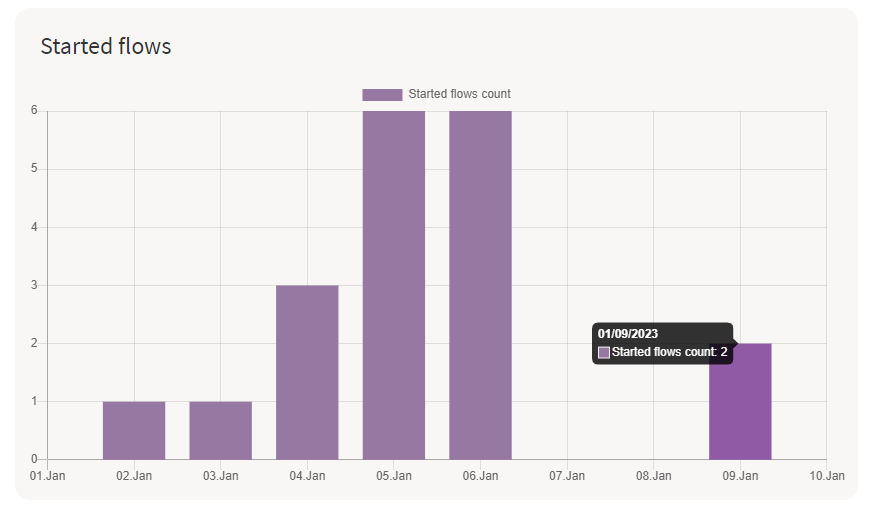
The graph of the started flows will look as follows:
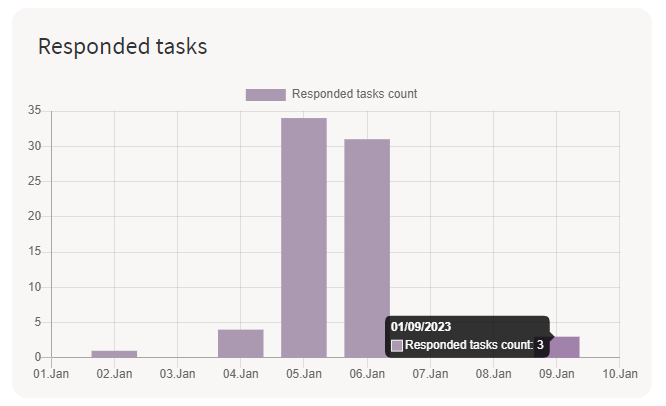
The graph of the responded tasks will look as follows:
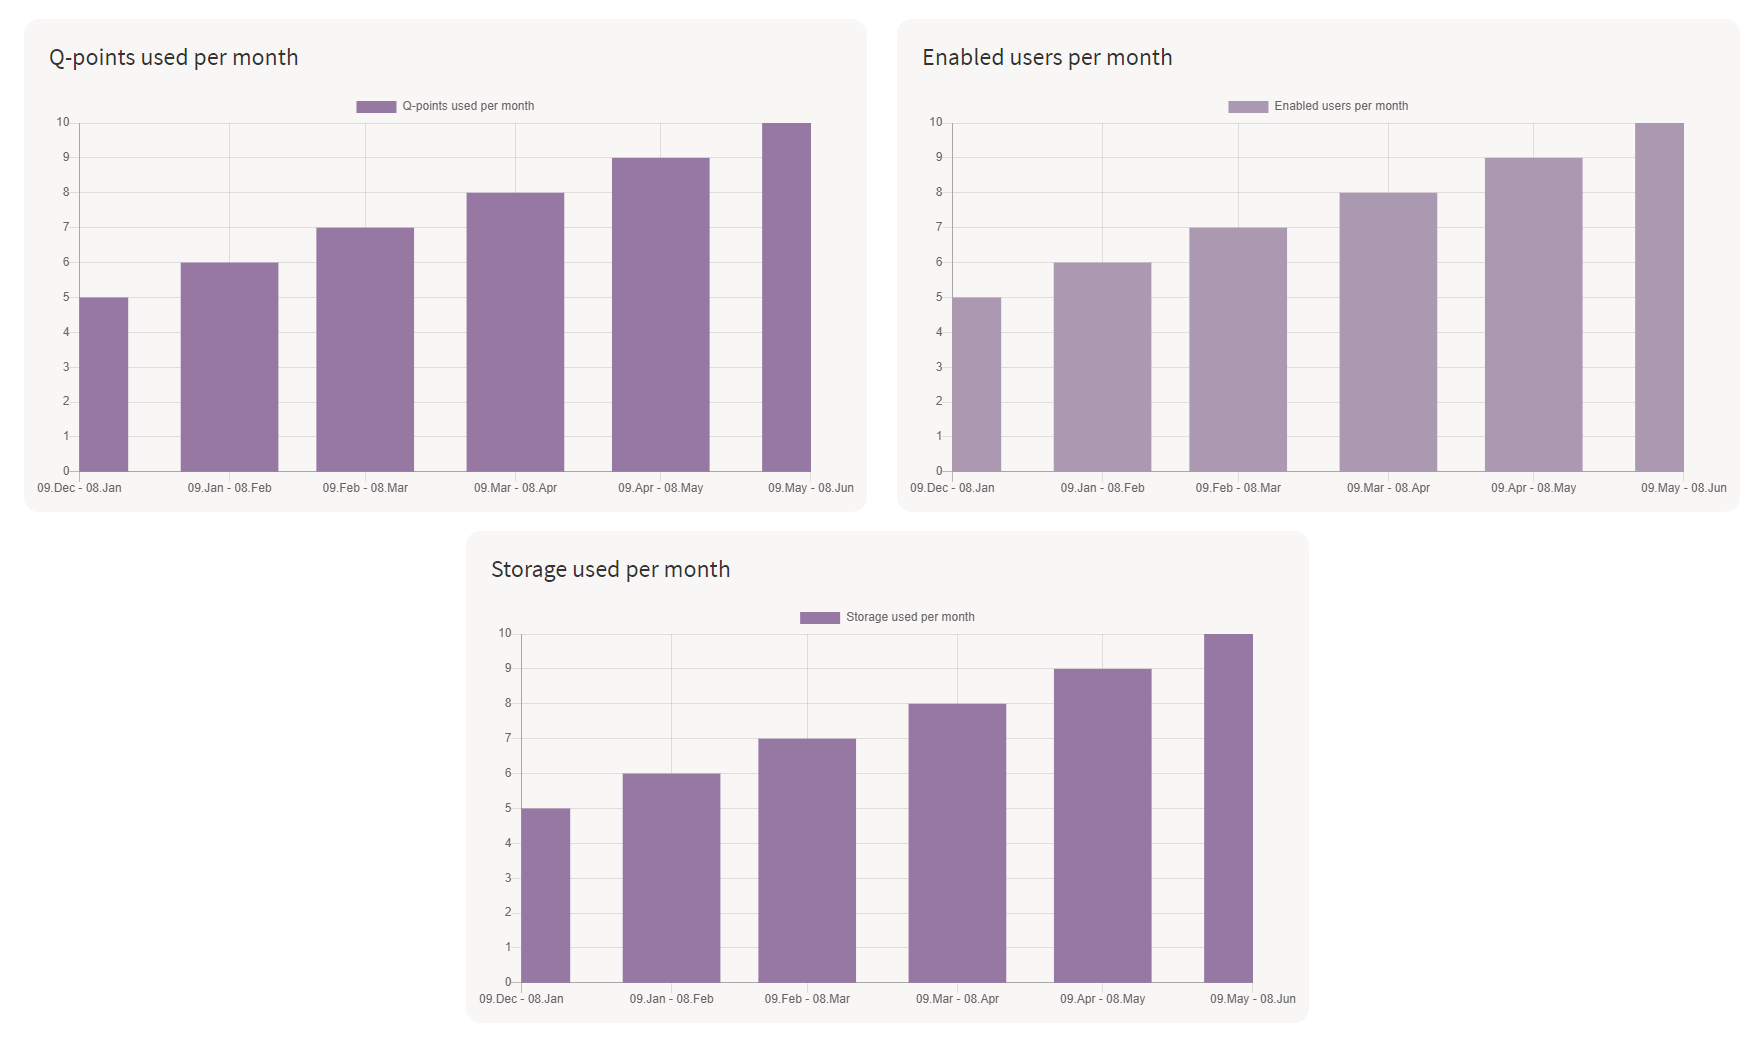
The statistics graphs of Q-points used, enabled users and storage statistics will be seen as follows:
Por último, si quiere más información sobre el resto de las opciónes del sitio que no se detallaron en el tutorial, con sus diferencias en la versión Cloud y OnPremise, puede ver el manual de Qflow Admin.